64 Major Housing Markets See Home Prices Fall
In the U.S., 21% of the 300 largest metro areas experienced a year-over-year decline in home prices by July 2026. The national annual price growth stands at 1.1%.
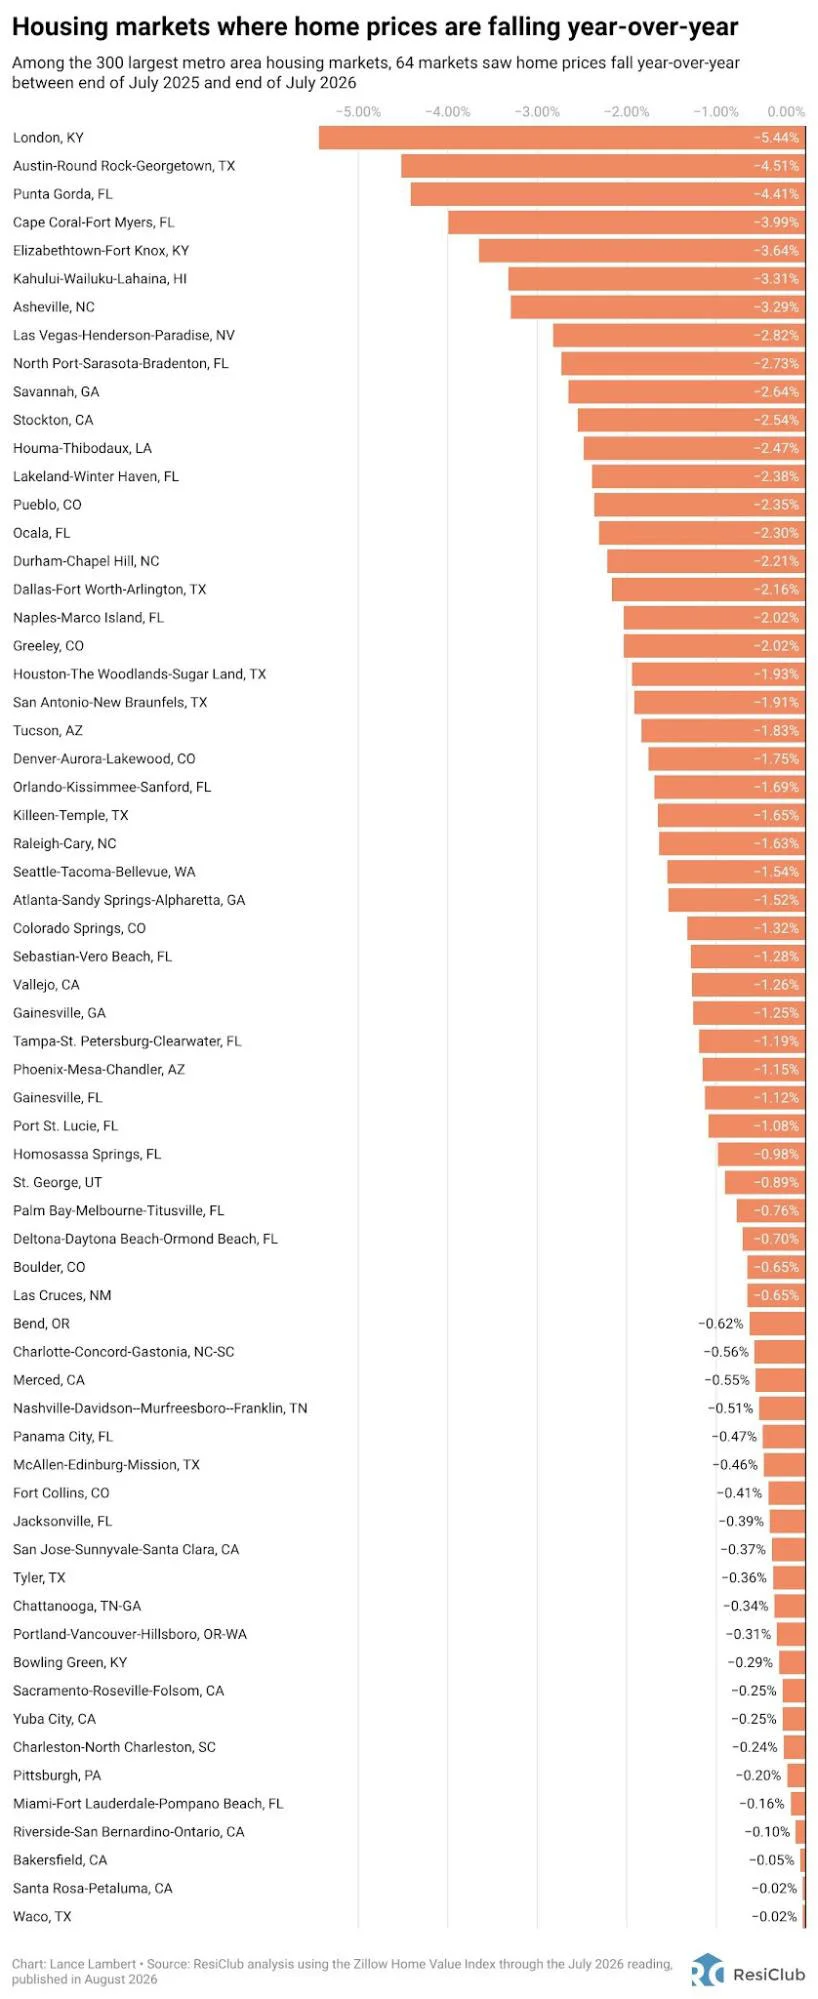
Sixty-four of the nation's 300 largest housing markets saw year-over-year home price declines by July 2026, representing 21% of these major markets. This figure indicates a notable shift compared to previous periods, although the national aggregate price growth remained positive.
Nationally, U.S. home prices increased by 1.1% year-over-year by July 2026. This marks a slight acceleration from the 0.2% growth recorded in July of the previous year. While the number of declining markets is significant, it is a decrease from the 33% of markets that experienced price drops in the year leading up to July 2023.
The most substantial price corrections are concentrated in Sun Belt states and the Mountain West. These regions experienced significant price surges during the pandemic and have also seen considerable new construction, which has increased supply and pressured resale values. In contrast, markets in the Northeast and Midwest, where inventory remains below pre-pandemic levels, have continued to see price increases.
Despite the 64 markets experiencing price declines, 236 markets are still showing year-over-year price increases. This divergence is expected to widen as the national market stabilizes. For instance, home prices in Hartford, CT, are up 28.7% from their 2022 peak, while Austin, TX, prices are down 27.2% from their 2022 peak.