Home Price Shifts Visualized Across Local Markets
A new analysis visualizes shifts in home prices across local housing markets using three maps sized by active inventory.
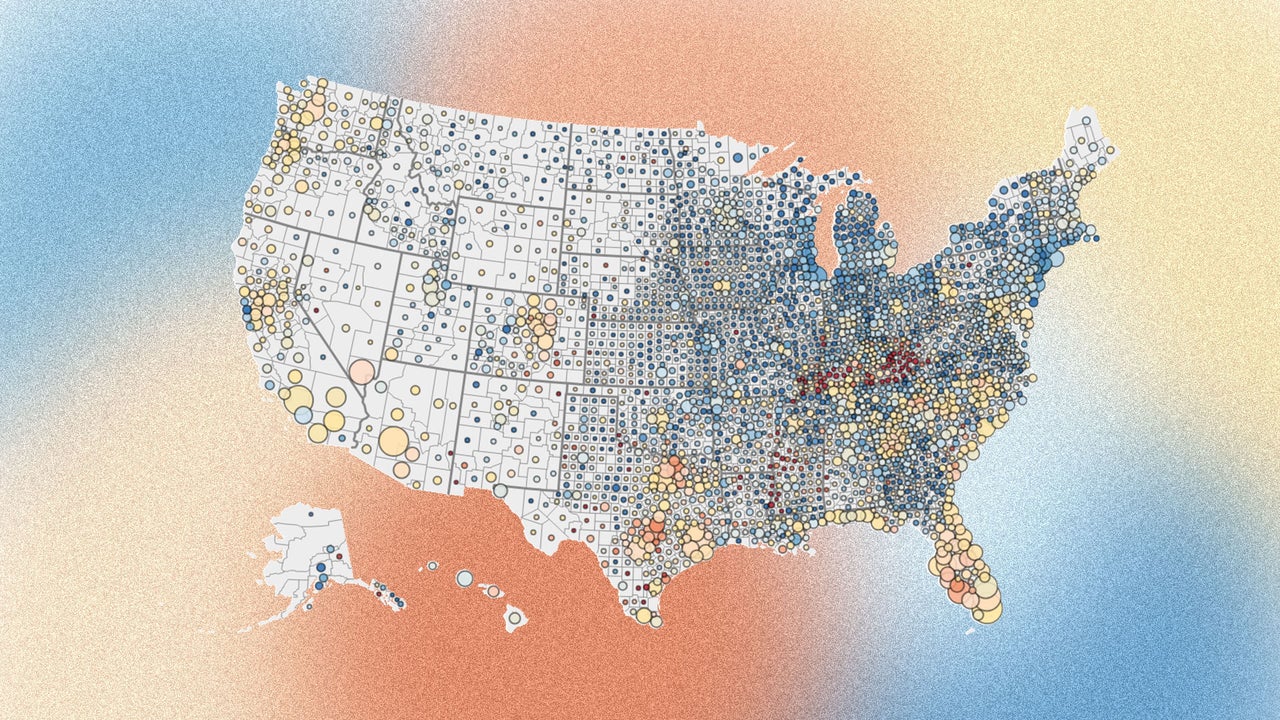
An analysis published by Fast Company offers a detailed look at home price trends in local U.S. housing markets. The analysis utilizes three maps that depict price changes relative to 2022 peaks and pre-pandemic levels from March 2020. Instead of solely relying on price changes, the maps also size each county by its active housing inventory for sale as of September 2026.
The analysis indicates that many markets in the Sunbelt region, including Austin, Texas, and Tampa and Cape Coral, Florida, experienced the most significant price surges during the pandemic. These areas also proved more vulnerable to price declines post-pandemic, partly due to supply elasticity and shifts in migration patterns. In contrast, markets in the Midwest demonstrated greater stability with more moderate price appreciation and stronger local purchasing power.
With rising interest rates and slowing migration, Sunbelt markets have seen more pronounced price corrections, while Midwest markets have remained comparatively resilient. According to Moody's Analytics, this has led to a notable decrease in overvaluation in the South and mild upticks in some Midwestern areas.
The report highlights how local conditions, such as housing inventory size, construction volume, migration, and local incomes, influence home prices differently across regions. The maps visually identify counties where prices remain below their peak (indicated in red) and those that have surpassed it (indicated in blue).