Home Prices Declining in 36 of 50 Largest U.S. Metros
A Realtor.com report indicates that home list prices have fallen year-over-year in 36 of the 50 largest U.S. metropolitan areas, signaling a cooling market.
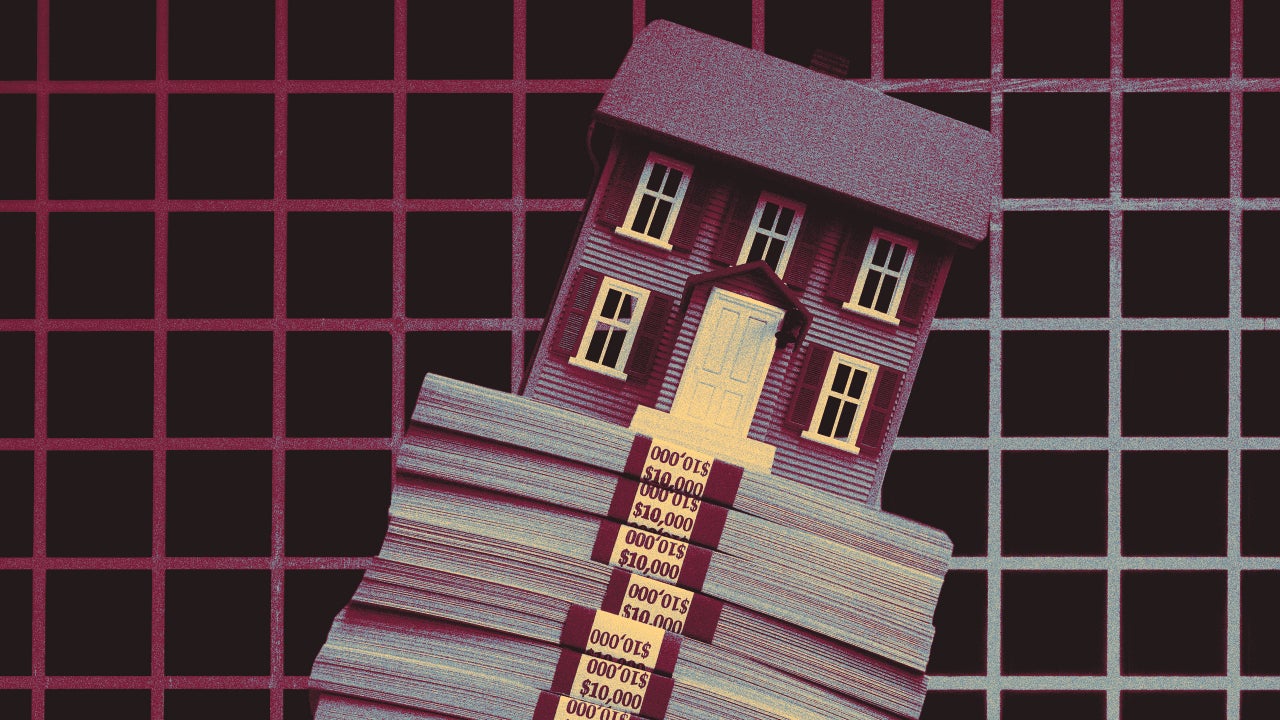
Home prices are seeing a national slowdown, with list prices falling in 36 of the 50 largest U.S. metropolitan areas, according to a new report from Realtor.com. The shifts are influenced by local market dynamics, persistent high mortgage rates, and the balance between housing supply and demand.
Nationally, the price per square foot decreased by 1.8% in August compared to the previous year, marking the tenth consecutive month of year-over-year declines. Median list prices fell in the Northeast, South, and West regions, while the Midwest saw stable prices during the same period.
Austin, Tampa, and Memphis experienced the most significant drops in price per square foot, declining by 8.1%, 5.6%, and 4.1%, respectively. In contrast, Providence, Indianapolis, and Chicago recorded price increases. Senior Economist Jake Krimmel at Realtor.com noted that many areas that saw rapid price growth during the pandemic are now reversing some of those gains, often accompanied by increased housing inventory.
In San Francisco, which saw an exodus of tech workers during the pandemic, the price per square foot fell by 3.9% in August. Despite this decrease, the median list price remains high at $908,700. Krimmel explained that this reflects a shift in the available inventory, with more affordable suburban homes becoming more common than smaller, expensive central properties. San Diego and Portland also saw price decreases.
As the housing market evolves and inventory grows, Realtor.com advises sellers in cooling markets to adopt realistic pricing strategies to facilitate sales.