Prismatic enhances integration troubleshooting with new execution visibility
Prismatic has launched new features, including 'execution sections' and redesigned views, to help software teams diagnose integration issues faster. The update aims to provide deeper visibility into how integrations run, reducing debugging time.
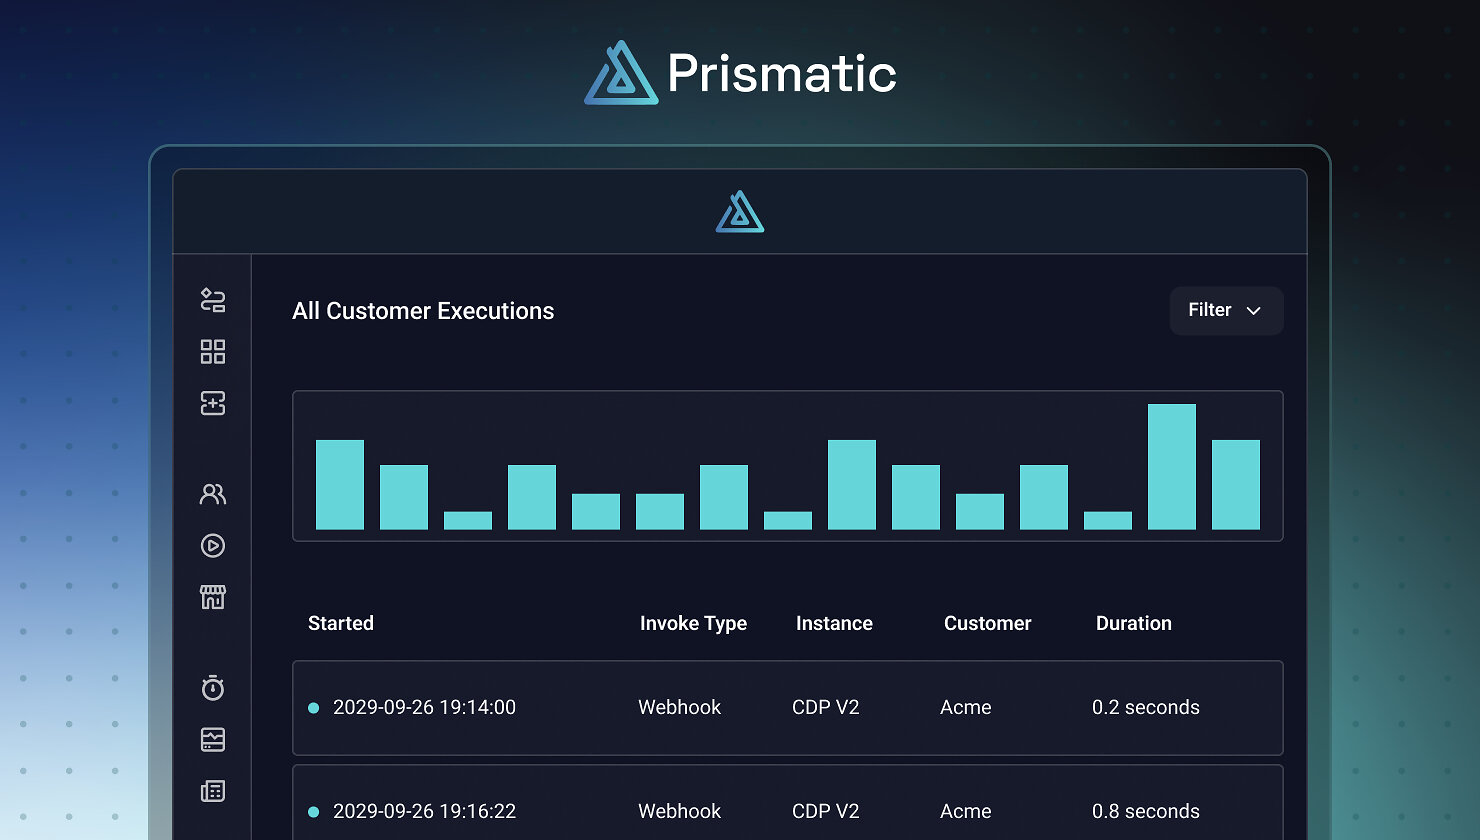
Prismatic, an AI-enabled embedded iPaaS for B2B SaaS companies, has released new capabilities designed to accelerate the diagnosis of integration issues for development teams. The update introduces "execution sections" for code-native integrations (CNI), providing step-by-step visibility into logic flows, similar to what is already available for low-code integrations.
Previously, code-native integrations ran as a single unit. When an error occurred, the system presented a single error message and developer-logged output, often requiring the original developer to resolve the problem. This lack of granular visibility could be a barrier for teams adopting code-native approaches, despite their potential for faster development.
The new "execution sections" allow developers to name distinct parts of their integration logic, such as "Sync EMEA" or "Fetch files," using the Prismatic SDK. This structured approach enables support and operations teams to quickly identify which specific section failed and examine its logs. Simultaneously, rebuilt list and detail views expedite the process of finding and diagnosing any integration run, whether code-native or low-code.
"Moving to code should never mean giving up visibility," stated Michael Zuercher, CEO and co-founder of Prismatic. "Execution sections make a code-native run readable to the whole team, and because code-native runs can now have structure, they become the foundation for AI that can read an execution and tell you what went wrong."
Prismatic states that these enhancements are available at no additional cost and are intended to significantly improve how teams manage and troubleshoot their integrations.